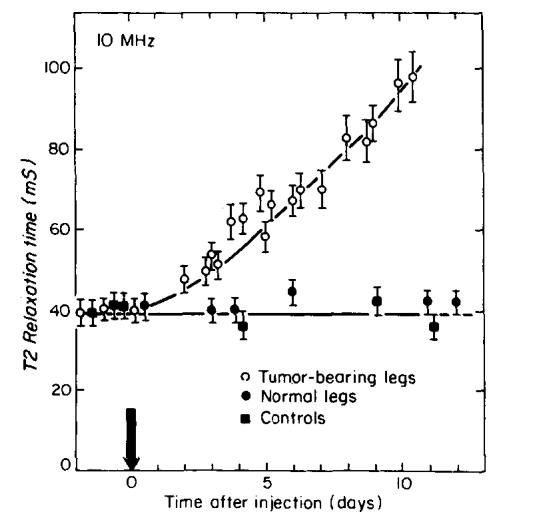
FIG. 6.

T2 of tumor-bearing legs as a function of time following injection. The time of injection is indicated by the arrow. The error bars show the estimated 7% standard deviation for T2 measurements. The solid squares are measurements taken from the right legs of tumor-bearing mice. The solid circles are measurements taken from normal mice.
