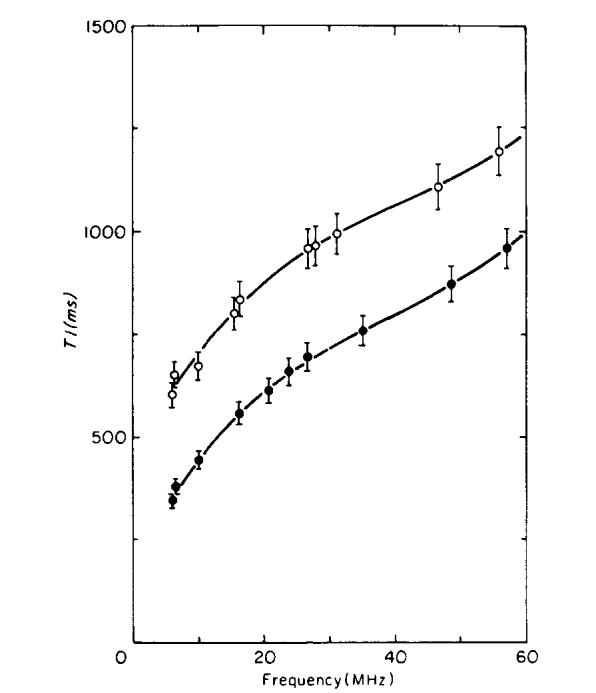
FIG. 7.

T1 vs frequency for normal and tumor-bearing legs. The open circles show T1 for tumor-bearing legs; the solid circles for normal mice. The error bars show the estimated 5% standard deviation in the measurements. The solid curves are fits to the data using polynomials of degree three.
