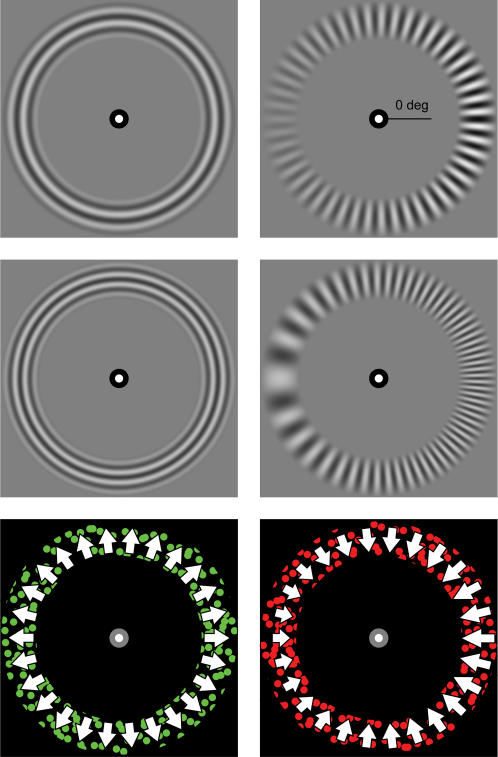
Figure 1. Stimuli used in the three experiments.
The top row depicts the stimulus used in Experiment 1 (contrast), the middle row the stimulus in Experiment 2 (spatial frequency) and the bottom row the stimulus in Experiment 3 (motion speed). For each row, the left image was presented to one eye, the right image to the other (the presentation was counterbalanced). In each of the experiments, the parameter under study was constant in one image (the CONST image; left column), while the parameter was varied in the other image (the VAR image; right column). The upper right image indicates the 0 deg position.

