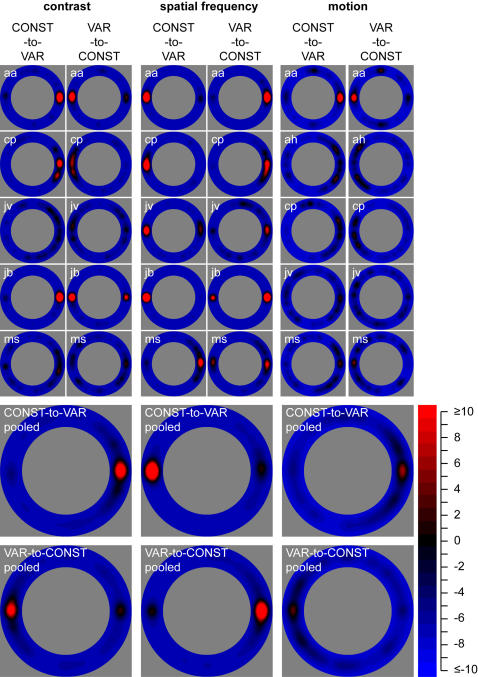
Figure 4. Results.
The first five rows show results of individual observers for each of the experiments. For each experiment, the left column represents z-scores for the CONST-to-VAR conditions, and the right column represents z-scores for the VAR-to-CONST conditions. The bottom two rows show pooled results for each of the experiments. Here, the first row of data represents z-scores for the CONST-to-VAR conditions for each of the experiments; the second row of data represents z-scores for the VAR-to-CONST conditions for each of the experiments. Importantly, the data represent most frequent mouse clicks for data rotated to the 0 deg position (as explained in the Results section). The colors in the graphs represent z-scores, where red indicates positive and blue negative z-scores.

