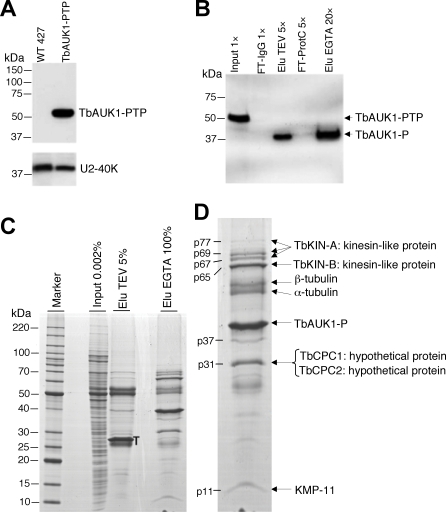
Figure 1. PTP purification and mass spectrometric identification of TbAUK1-associated proteins.
(A) Whole lysates of WT 427 and TbAUK1-PTP cells were separated on a 10% SDS-polyacrylamide gel, blotted, and detected with the protein A-specific PAP reagent. The same blot was stained with a polyclonal antibody against U2-40K, a nuclear spliceosomal protein, as a loading control. (B) TbAUK1-PTP and TbAUK1-P following TEV protease digestion were detected with anti-ProtC antibody in the input material, IgG Sepharose column flow-through (FT-IgG), TEV protease-digested eluate (Elu TEV), anti-ProtC matrix flow-through (FT-ProtC), and final EGTA eluate (Elu EGTA). Values with x on top indicate relative amount of each fraction analyzed. (C) Coomassie staining of purified proteins. Elu EGTA was separated on a 10 to 20% SDS-polyacrylamide gradient gel and stained with Coomassie. For comparison, 0.002% of Input and 5% of Elu TEV were co-analyzed. T, TEV protease. (D). Mass spectrometric identification of the precipitated proteins. p77, p69, p67, etc stand for the estimated molecular masses of individual protein bands. On the left of panels A, B, and C, sizes of protein marker bands are indicated.

