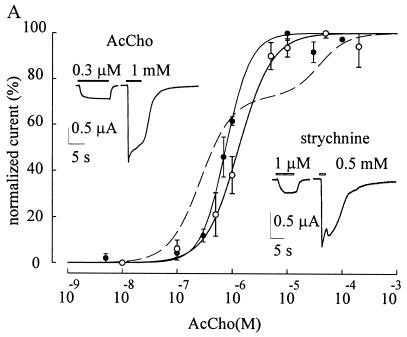
Figure 5.
Membrane currents from oocytes injected with a mixture of cDNA encoding mut1 and mut2 subunits with ratio of 1:1. AcCho dose/IAcCho relationship (●) and strychnine dose/Istrych relationship (○) both best-fitted to a single Hill equation from the same oocytes. For AcCho the EC50 and nH values determined from the fit were 0.77 μM and 1.9, respectively. The AcCho currents were normalized to that evoked by 10 μM AcCho (IAcCho mean amplitude: −2.4 μA). For the same oocytes strychnine EC50 and nH values were 1.3 μM and 1.4, respectively. Strychnine currents were normalized to that evoked by 50 μM strychnine (Istrych mean amplitude: −0.92 μA). Each point represents the mean ± SEM (10/2). Dashed line represents the theoretical curve for the expression of mut1 and mut2 receptors and lack of hybrids (values of EC50 and nH for pure mut1 and mut2 receptors, as in Table 1). (Insets) Sample IAcCho (Left) and Istrych (Right) at indicated concentrations.

