
Figure 8.
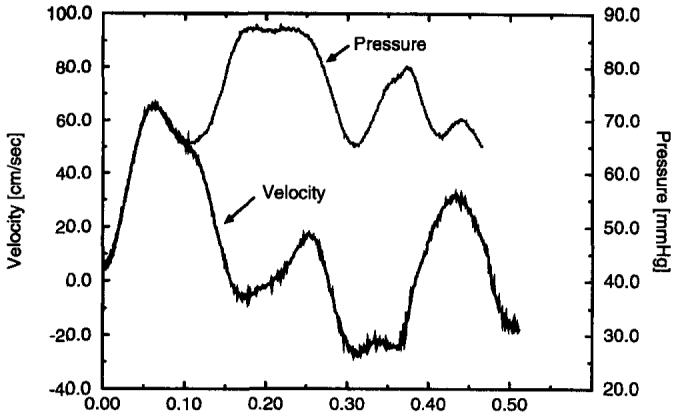
Example pressure and velocity traces during the first 512 msec of the 1,500-msec cycle. The pressure waveform is scaled and shifted by use of the Navier-Stokes relationship to match the velocity waveform at the same position in the tube. The congruence of the curves until just past the peak suggests the existence of a discrete reflecting site downstream of the measurement point and the insensitivity of the leading edge of the waveform to reflections.