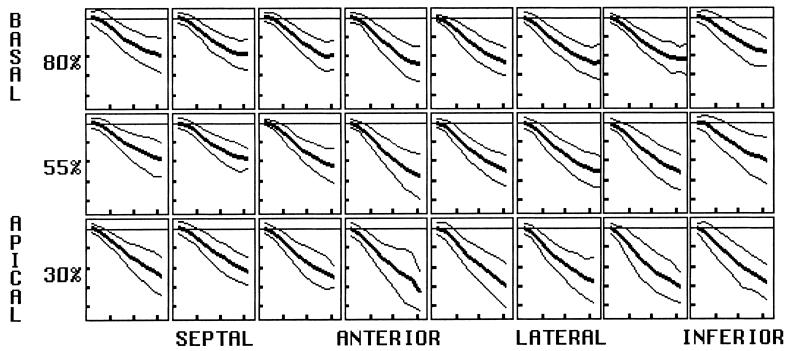
FIG. 7.
Circumferential strain (mean and both 2-SD deviation curves) plotted as fractional length change. Values are negative, representing contraction. The magnitude is greatest in the anterolateral wall and increases toward the apex. Horizontal tics represent 100 ms, and vertical tics represent 0.1 (10 contraction).

