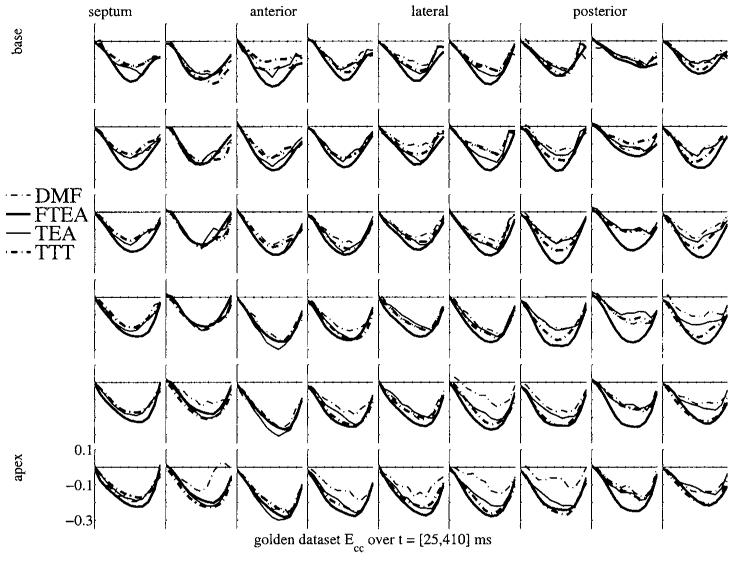
Figure 4.
Circumferential shortening (Ecc) strain map for the golden dataset for the four methods. Each box shows the strain Ecc as a function of time over systole and early diastole. Thick lines are the 4D methods (FTEA and TTT), thin lines are the 3D methods (DMF and TEA). Broken lines represent the Cartesian methods (DMF and TTT), and full lines represent the ‘polar’ methods (TEA and FTEA).

