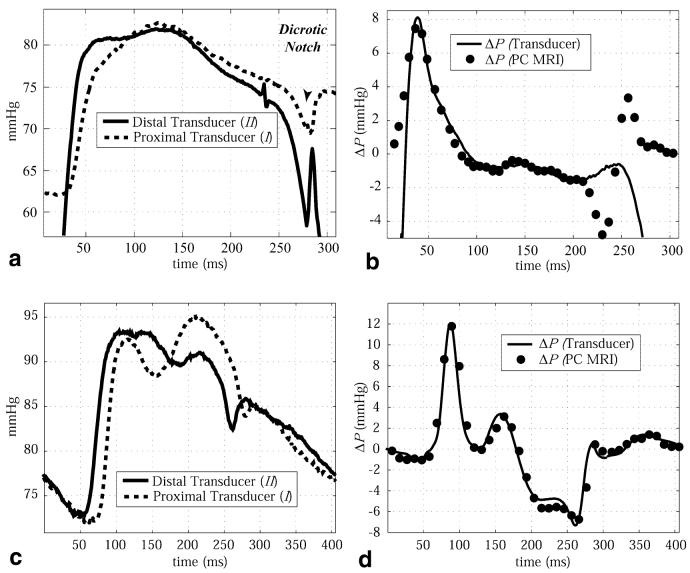
FIG. 3.
a: Absolute blood pressures measured in the ascending aorta and LV cavity in a canine subject using the dual head Millar pressure catheter. Pressure transducer locations are shown in Fig. 1a. Note that only 300 ms of the total 500-ms cardiac cycle is shown. b: The transvalvular pressure differences between the transducer tips, measured with the Millar catheters (solid line), are compared with the pressure differences calculated with PC-MRI velocity data (circles). c: Absolute blood pressures measured at two locations in the descending aorta of a canine subject using the dual head Millar pressure catheter. Pressure transducer locations are shown in Fig. 1b. d: The pressure differences between the transducer tips, measured with the Millar catheters (solid line), are compared with the pressure differences calculated with PC-MRI velocity data (circles).

