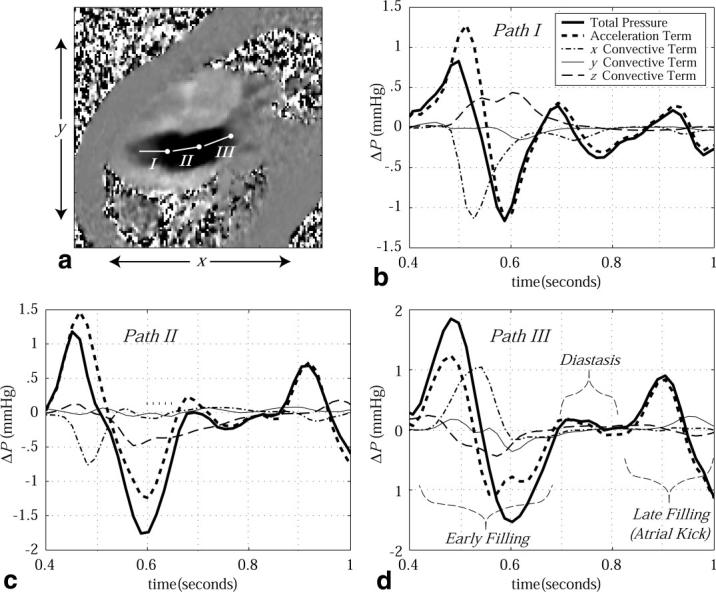
FIG. 5.

a: A PC image displays the x-directed velocity component during LV filling (inflow tract) at ∼500 ms following the QRS trigger. Pressure drops across three paths (labeled I, II, and III) are displayed as a function of time throughout diastole in b–d. For all cases, the component pressure drops from the local acceleration and three orthogonal convective terms are displayed, along with the total pressure drop. Three stages of diastole (early filling, diastasis and late filling) are labeled. The pressure reference location for each path is indicated by a node.
