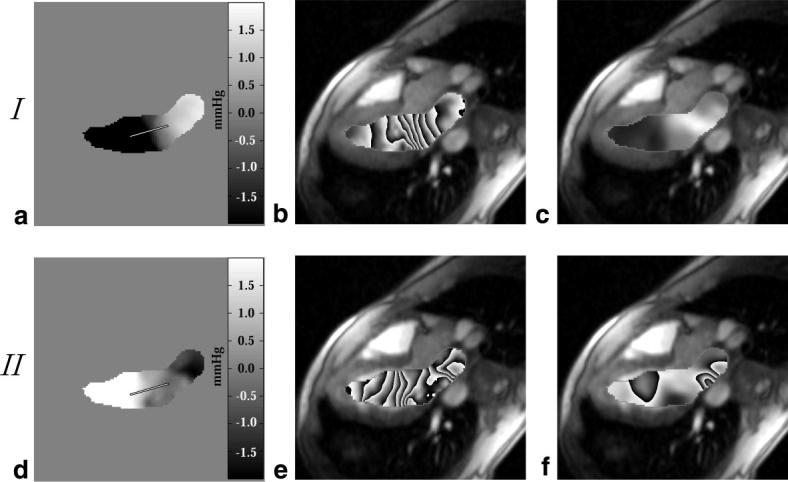
FIG. 7.

Pressure difference maps calculated with Eq. [5] are displayed during LV filling at (a) 500 ms after the QRS trigger and (d) 650 ms after the QRS trigger. The pressure difference fields from a and d are displayed using a phase representation in b and e, where each cycle from black to white and back to black corresponds to a change in pressure of 0.5 mmHg. The contributions to the total pressure field from the z-convective term for these two sample frames are displayed in c and f.
