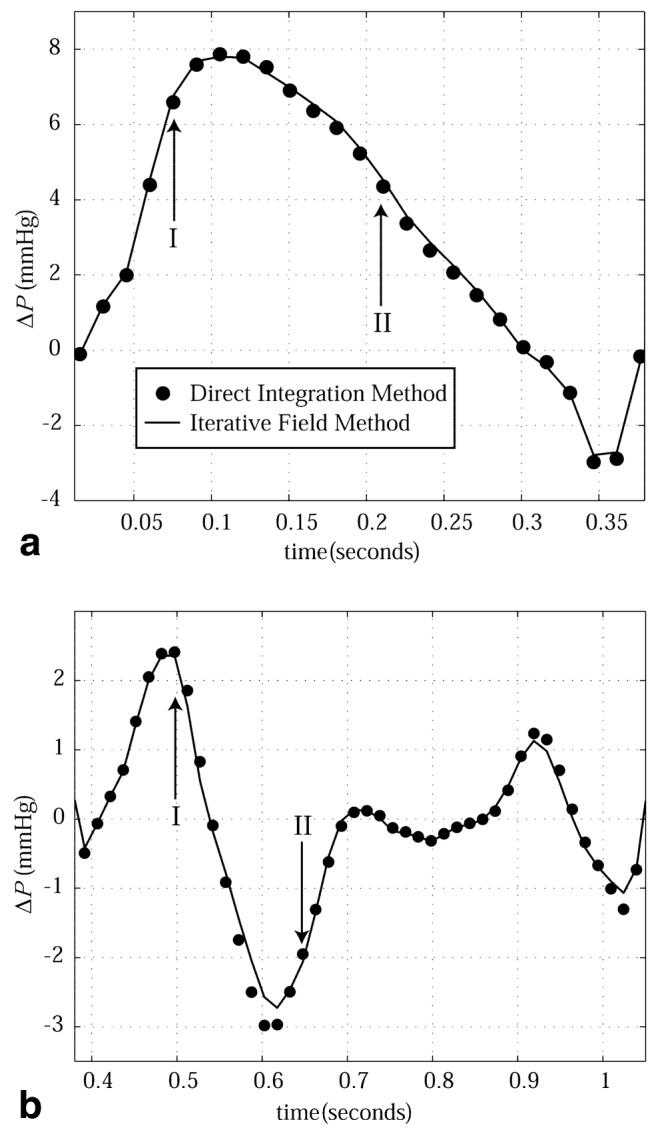
FIG. 8.

Intracardiac pressure differences calculated with the direct integration method (circles) and the iterative field method (solid line) are compared. The outflow tract pressure differences shown in a are between the endpoints of the path displayed in Fig. 6a and d. The filling pressure differences shown in b are between the endpoints of the path displayed in Fig. 7a and d.
