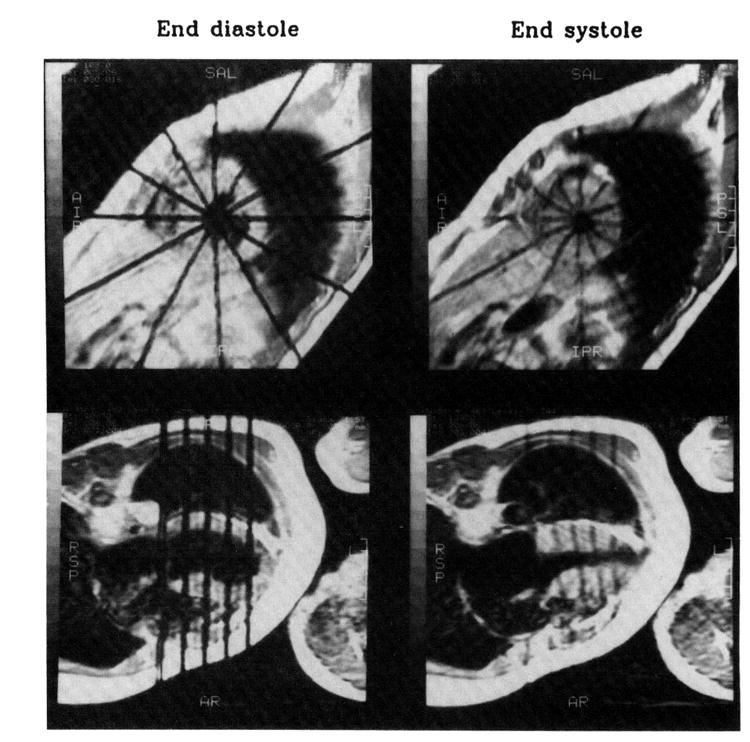
Fig 1.

Short-axis and long-axis images from a patient with hypertrophic cardiomyopathy. Tags (black lines) were placed at end diastoleand persisted to end systole. The short-axis images correspond to the second slice from the base, and long-axis images correspond to the plane that cuts through the middle of the ventricular septum at both end diastole and end systole. Note that at end diastole, the tag lines are straight, and at end systole, the tag lines are displaced because of myocardial contraction. In long-axis images, during systole parallel tags moved downward toward the apex, which hardly moved at all. (The fifth tag line at mitral valve level is an extra one thatwas not used in the analysis.)
