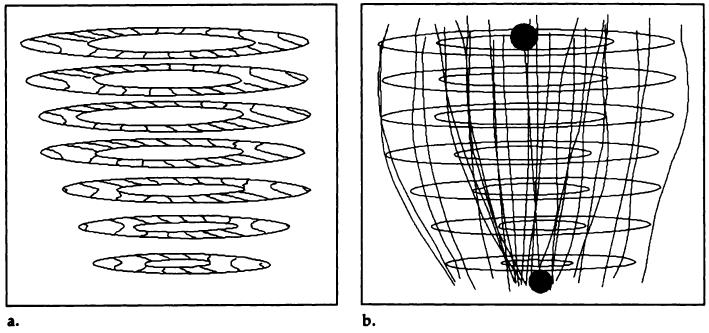
Figure 2.
(a) Typical 3D short-axis tag data set for x-displacement in an in vivo heart of a healthy volunteer. Image shows the appearance of the tags and the contours near end systole on seven short-axis image planes. (b) Typical 3D contour data set and the estimated prolate spheroidal centroid (upper gray circle) and apical focal point (lower black circle).

