
Figure 3.
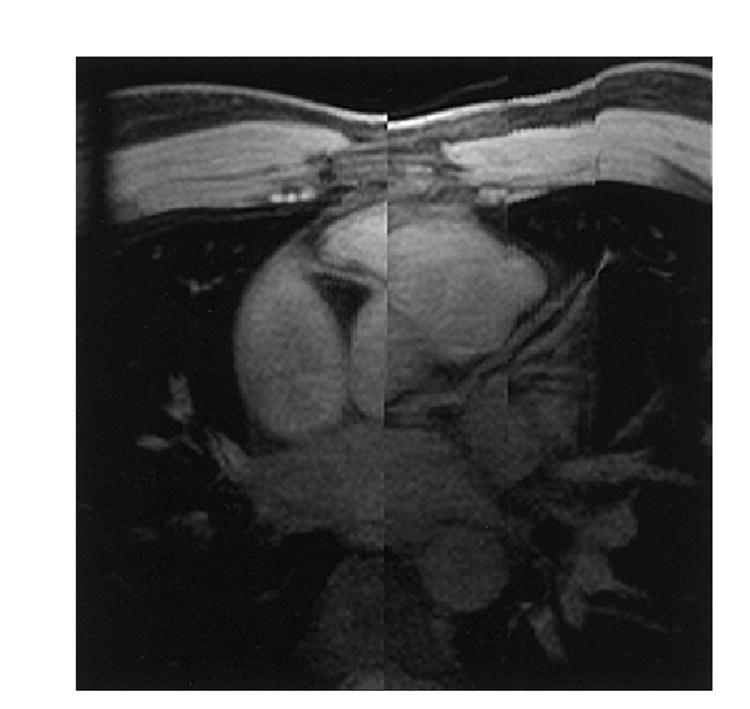
An image processed with a localized MIP algorithm using the same 3D data set as shown in Figure 2. This figure shows much longer segments of the coronary arteries than the sections shown in Figure 2. Because the displacement in the superior/inferior direction between the root of RCA and the root of LM, this figure appears to have ‘split-screen’ in the middle.