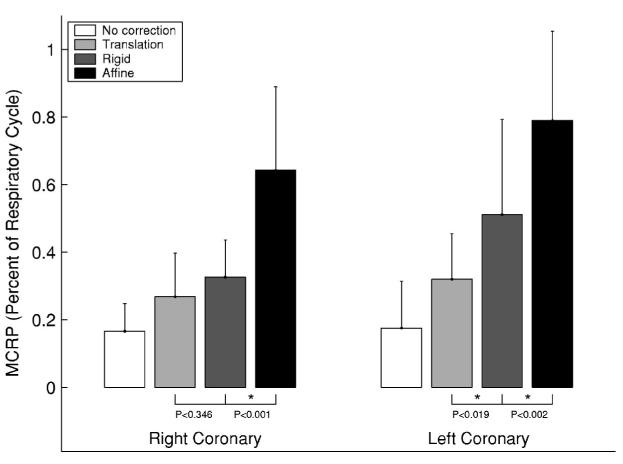
Fig. 4.
Motion corrected respiratory rest period (MCRRP) duration at end expiration: A comparison of three different motion models. The physiologic motion is shown as a base line reference. Two Bonferroni corrected t-tests were performed for each artery to test for incremental differences in the MCRRP. A group-wise statistical significance of α<0.05 is indicated by an asterisk (*). P values are provided for all t-tests.

