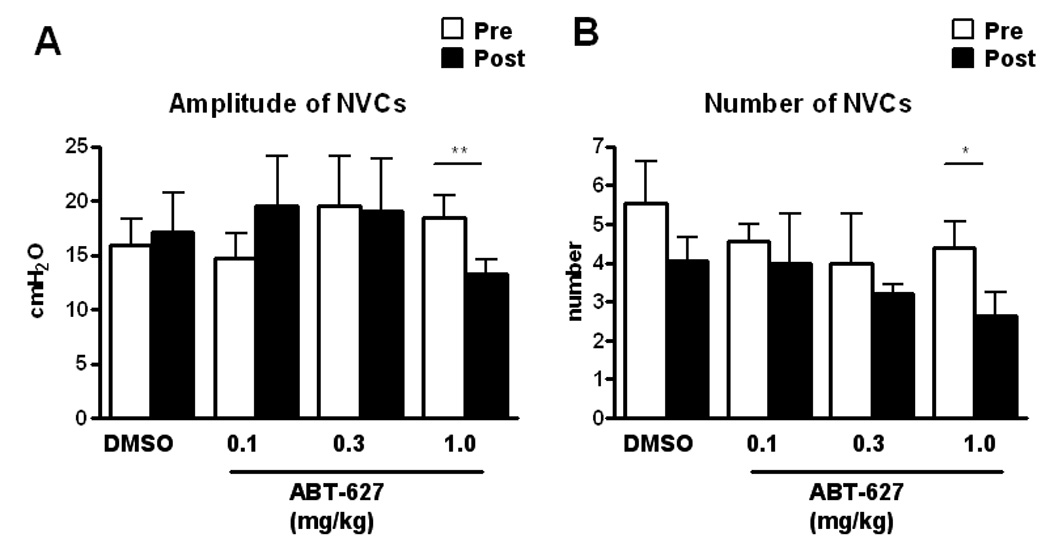
Fig. 2.

Amplitudes (A) and the number of non voiding contractions (B) in SCI rats before (Pre) and after (Post) intravenous administration of vehicle (DMSO) and ABT-627 (0.1–1.0 mg/kg). Each histogram represents mean ± S.E. **P < 0.01, *P < 0.05 compared with pre-drug values.
