
Fig. 3.
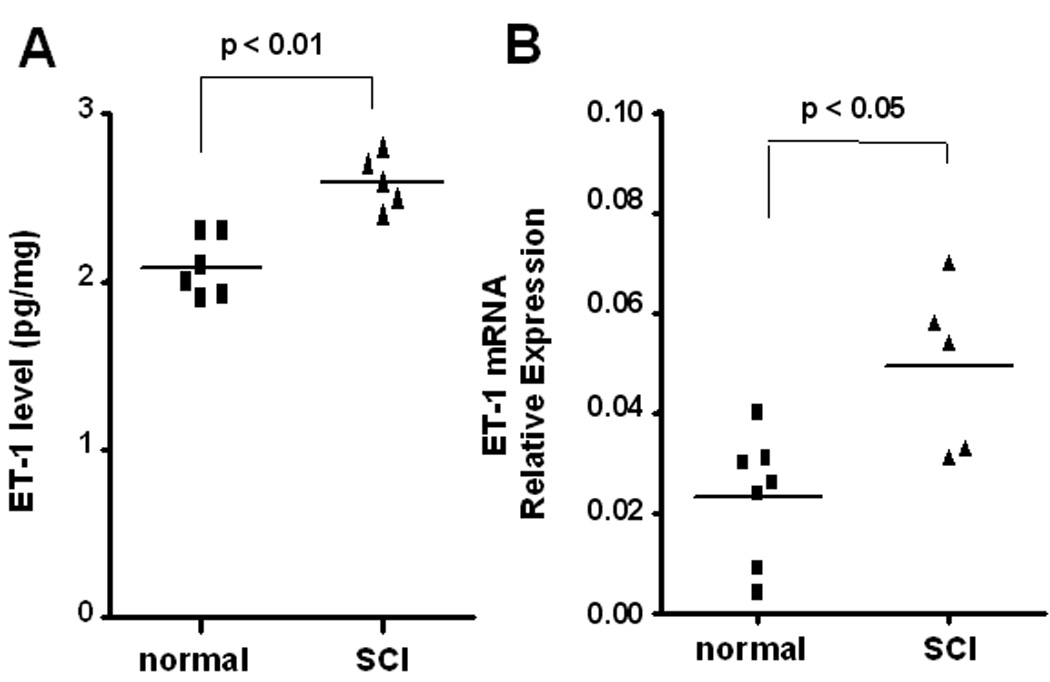
A: ELISA measurements of ET-1 in the bladder of normal rats (n=6) and SCI rats (n=5). ET-1 values were normalized to tissue protein and expressed in pg/mg total protein. B: Expression of ET-1 mRNA in the bladder of normal rats (n=7) and SCI rats (n=5). Relative expression levels of ET-1 mRNA were normalized against β-actin. Each bar represents mean ± S.E.