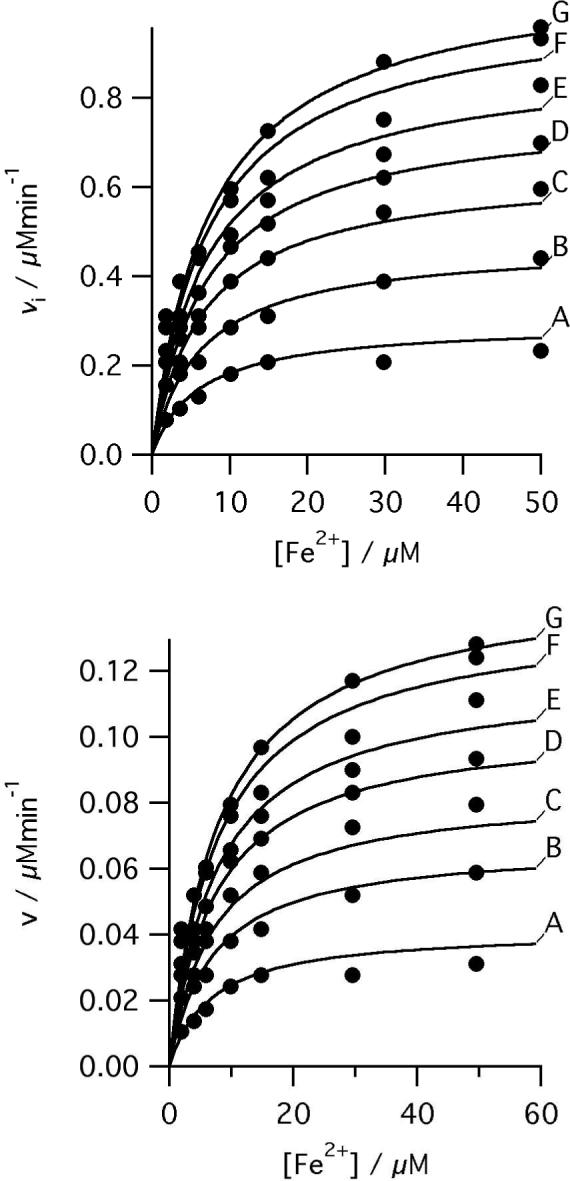
Figure 1.

Initial rates of ferrochelatase catalyzed insertion of iron into deuteroporphyrin at pH 8.1, 100mM TRIS-HCl, 250 μM Fe2+, 1mM β mercaptoethanol, 0.5% (v/v) Tween 20, 30°C. Top, 0.17 μM R115L ferrochelatase, deuteroporphyrin concentrations were A 1.8 μM, B 3.6 μM, C 6.3 μM, D 9.9 μM, E 15.3 μM, F 29.7 μM, and G 49.6 μM. The points are experimental and the theoretical lines are described by equation 1 with characterizing parameters KmFe 7.7 ± 1.4 μM, KmDIX 5.5 ± 0.5 μM, KFe.DIX 30.54 ± 8.01 μM2, V 1.21 μMmin−1. Bottom, 0.16 μM R115L, E343D ferrochelatase, deuteroporphyrin concentrations were A 1.9 μM, B 4.0 μM, C 5.9 μM, D 9.9 μM, E 14.9 μM, F 29.7 μM, and G 49.7 μM. The points are experimental and the theoretical lines are described by equation 1 with characterizing parameters KmFe 8.2 ± 1.0 μM, KmDIX 5.8 ± 0.8 μM, KFe.DIX 34.8 ± 8.3 μM2, V 0.16 ± 0.01 μMmin−1.
