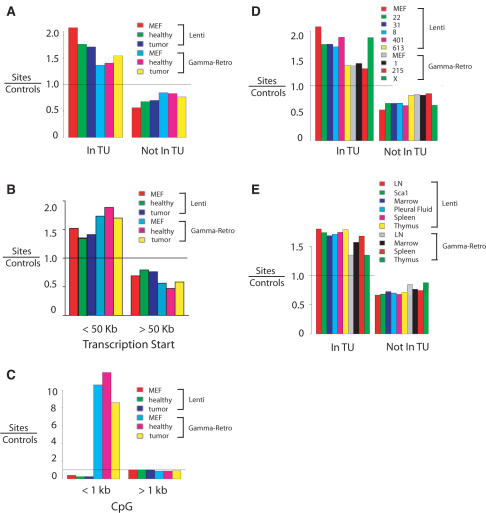
Figure 2.
Lentiviral vector and gamma-retroviral vector integration site distributions in the murine genome. Vector integration sites for pooled samples were compared to their matched random control sites. In the matching procedure (20), each unique integration site was matched with 10 control sites in the genome randomly selected in silico that were constrained to lie the same distance from an MseI recognition site as the experimentally determined integration site. Comparison of experimentally determined integration sites to the matched random controls thus ‘washed out’ any possible biases introduced by the use of MseI cleavage. A value above 1 indicates favored integration relative to random control sites; a value below 1 indicates disfavored integration. (A) Frequency of integration in transcription units. MEF: control integration sites from cultured murine embryonic fibroblasts. Healthy: control healthy mice. Tumor: mice with lymphoproliferation. (B) Frequency of integration near transcription start site. (C) Frequency of integration near CpG islands. (D) Frequency of integration in transcription units. In this analysis the integration site data sets are pooled for all tissues from each mouse. (E) Frequency of integration in transcription units for integration sites pooled by tissue of origin (samples from liver are not included in this analysis due to the low number of integration sites). Comparisons between the lentiviral and gamma-retroviral vectors in each of the panels achieved P <0.0001 (Fisher's exact test). Comprehensive analysis of integration frequency relative to many genomic features can be found in Supplementary Data 1–3.

