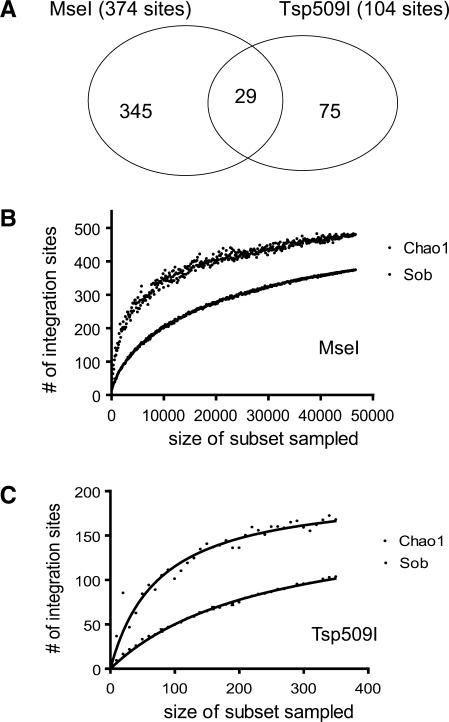
Figure 4.
Severe biases in recovery of integration sites arising due to use of different restriction enzymes. (A) Venn diagram indicating the overlap between integration sites isolated by cleaving genomic DNA with MseI versus Tsp509I. (B) Collector's curve (rarefaction) analysis of integration sites recovered after MseI cleavage. Repeated samples of integration site subsets were used to evaluate whether further sampling would likely yield additional integration sites (rarefaction analysis), as indicated by whether the curve has reached a plateau value. The y-axis indicates the number of integration site sequences detected, the x-axis the number of integration sites in the subset analyzed. ‘Sob’ (Species-observed) indicates rarefaction on the original data. The Chao1 estimator was used to estimate the number of undetected integration sites from frequency of isolation information. ‘Chao1’ indicates collector's curve analysis on Chao1 estimates for sequence subsets. (C) Collector's curve analysis for integration sites recovered after cleavage of genomic DNA with Tsp509I. Markings as in (B).

