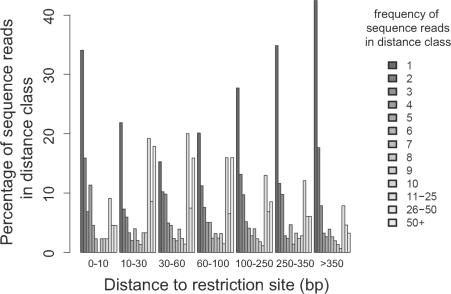
Figure 5.
Bias in recovery of integration sites due to the distance between integration sites and the closest MseI sites. The distribution of counts of identical sequence reads is shown as a function of distance to the nearest restriction site. The y-axis represents the percentage of integration sites with the indicated frequencies of isolation, and the x-axis is the range of distances between integration sites and their nearby MseI restriction sites used for binning.

