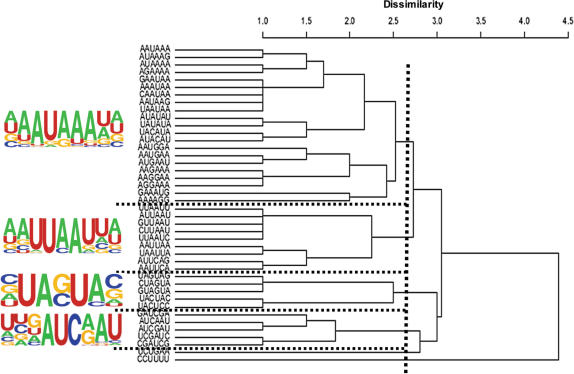
Figure 3.
An example (NUE) of how sequence logos were constructed. Dissimilarity distances between signals are calculated by using dynamic programming and then agglomerated by an R program. The suggested cutoff value of 2.6 was used. Hexamers in the same group were further aligned by ClustalW. The logos were generated using Web Logo tool based on ClustalW and their relative frequency in the derived region. The dotted lines indicate grouping regions.

