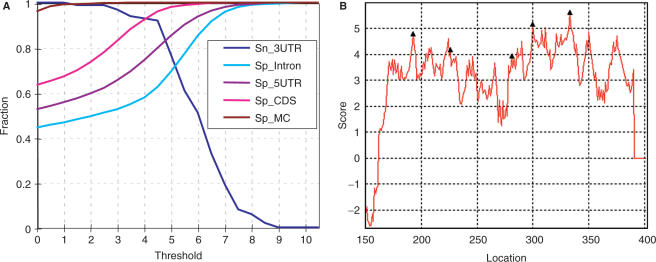
Figure 6.
Representative outputs and evaluation parameters of PASS-Rice. (A) The Sn and Sp based on PASS-Rice. The Sp values were calculated based on rice intron, 5′-UTR, coding sequences (CDS) and a random sequence set generated by Markov chain (MC) based on the 2nd order trinucleotide distribution of rice 3′-UTR. (B) An example output of PASS-Rice using Los_03g61890 with multiple poly(A) sites. Triangles indicate the poly(A) sites confirmed by EST data.

