
Table 1.
Cis-elements for mRNA polyadenylation in rice
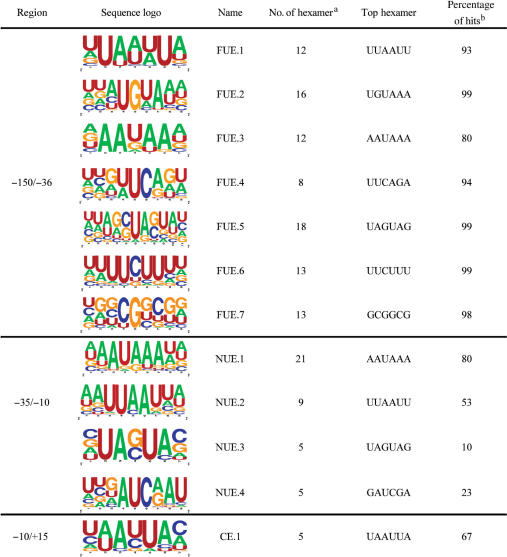 |
aThe number of hexamers that were used to produce the logo.
bIndicate the percentage of signal patterns the logo can represent in the defined region (FUE, NUE or CE).
Official websites use .gov
A
.gov website belongs to an official
government organization in the United States.
Secure .gov websites use HTTPS
A lock (
) or https:// means you've safely
connected to the .gov website. Share sensitive
information only on official, secure websites.
Cis-elements for mRNA polyadenylation in rice
|
aThe number of hexamers that were used to produce the logo.
bIndicate the percentage of signal patterns the logo can represent in the defined region (FUE, NUE or CE).