Figure 2.
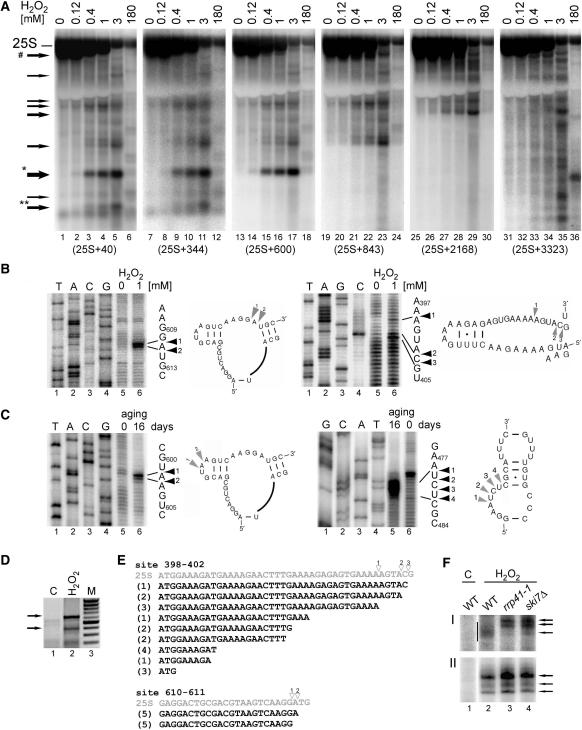
Main cleavage sites in the 25S rRNA are located in loop regions. (A) Northern hybridizations of total yeast RNA extracted from wild-type W303 cells treated with different concentrations of H2O2. Hybridizations with probes against 25S (probe 007, position +40, lanes 1–6; probe W234, position +344, lanes 7–12; probe W236, position +600, lanes 13–18; probe W238, position +843, lanes 19–24; probe W239, position +2168, lanes 25–30 and probe W240, position +3323, lanes 31–36). Asterisks above the arrows indicate the products that were further analysed. Arrow marked with a hatch shows a band matching the potential 3′ product of the major cleavage, 5′ product is marked with one asterisk. (B–C) Primer extension analysis for two main cleavage sites in the 25S rRNA in W303 cells treated with 1 mM H2O2 (A) and in 16-day old chronologically aged rho0 W303 cells (B). Primer extensions were performed using primers W235 for sites around positions +400 and +470 and W237 for sites around position +600 relative to the 5′ end of the mature 25S. DNA sequencing on a PCR product encompassing the 5′ end of the 25S from +40 to +701, using the same primers was run in parallel on 6% sequencing polyacrylamide gels (lanes 1–4). The sequences with primer extension stops are shown on the right. Secondary structures of the regions in the vicinity of the cleavages, indicated by arrowheads and shown beside corresponding primer extension reactions, were adapted from the website http://rna.icmb.utexas.edu/. (D–E) 3′ ends of cleaved-off products for the major cleavage at positions +610–611 were mapped by 3′ RACE. (D) PCR reactions on cDNA prepared using total RNA from untreated control (lane 1, C) and cells treated with 1 mM H2O2 (lane 2). To generate cDNA, total RNA that had been ligated to an ‘anchor’ oligonucleotide (W242) with T4 RNA ligase, was reverse transcribed using a primer specific for the anchor (W243). This was followed by PCR reaction using the same 3′ primer and the 5′ primer starting at position +50 in the 25S rRNA (W241). Arrows indicate products corresponding to fragments cleaved at +398–404 (lower) and +610–611 (upper). PCR fragments were cloned into pGEM-Teasy and sequenced. (E) Sequences obtained by the 3′ RACE analysis for fragments cleaved at site +398–403 (19 independent clones) and site +610–611 (10 independent clones). The corresponding regions of the 25S with cleavage sites mapped by primer extension and indicated with empty arrowheads are shown above in grey. Figures in parentheses show the number of identical clones. (F) Mapping 3′ ends of two major cleavages sites using RNase H cleavage on total RNA extracted from wild-type, rrp41-1 and ski7Δ cells treated with 1mM H2O2 (lanes, 2–4) and from wild-type untreated control (lane 1, C). RNase H treatment was performed on RNA samples annealed to DNA oligonucleotides W244 and W263 complementary to positions +271 and +510, respectively. Samples were separated on a 8% acrylamide gel and hybridized with probe W234 (F-I) and probe W264 (F-II) to detect 3′ ends of fragments cleaved at +398–403 (F-I) and at +610–611 (F-II), respectively. Arrows show more defined 3′ ends of products cleaved at +610–611 for all strains and at +398–403 in the mutants; vertical bar in F-I indicates heterogenous 3′ ends of products cleaved at +398–403 in wild-type cells.

