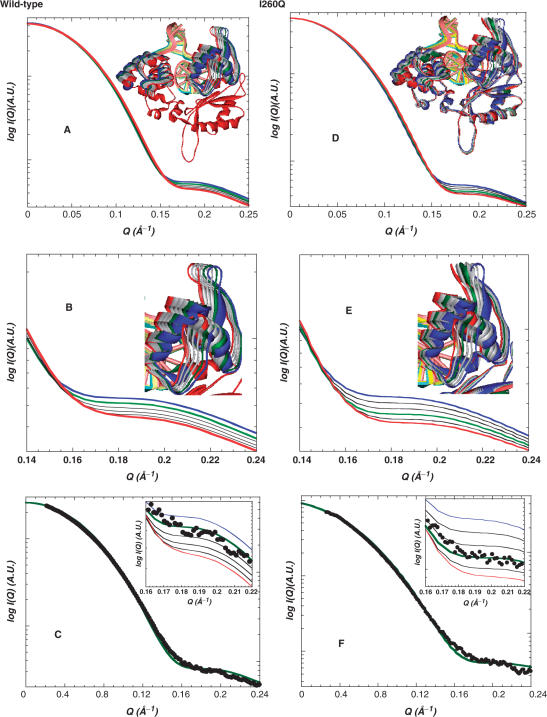
Figure 4.
SAXS and the molecular modeling studies of the binary and ternary complexes of WT Pol β (panels A–C) and I260Q (panels D–F). (A) A set of intercalated structures (inset), including the binary complex (blue), mismatched ternary complex (green) and matched ternary complex (red) of WT Pol β, along with the predicted SAXS patterns, including the binary (blue), mismatched (green) and matched ternary (red) complexes, calculated from the crystal and intercalated structures shown in the Q-range up to 0.25 Å−1. (B) Same as panel A, only the structures of the dNTP-binding subdomain (inset) and the predicted SAXS pattern of WT complexes in the Q-range between 0.12 and 0.24 Å−1 are shown. (C) Superimposition of the experimental SAXS data (filled circle) for the G:G mismatched complex of WT Pol β in Figure 3B and the calculated SAXS patterns in panel B. The experimental data fit best with the first intercalated curve (the green SAXS curve in panel B). Chi-squared value for the goodness of fit was 3.02. The data fit in the Q-range between 0.16 and 0.22 Å−1 are shown in the inset. (D) Similar to panel A, the modeled structures (inset) and predicted SAXS patterns, including the binary (blue), G:G mismatched ternary (green) and matched ternary (red) complexes of I260Q, calculated form the modeled structures in the Q-range up to 0.25 Å−1 are shown. (E) Same as panel D, only the structures of the dNTP-binding subdomain (inset) and the predicted SAXS pattern of I260Q complexes in the Q-range between 0.12 and 0.24 Å−1 are shown. (F) Superimposition of the experimental SAXS data (filled circle) for the G:G mismatched complex of I260Q in Figure 3C and the calculated SAXS patterns in panel E. The experimental data fit best with the first intercalated curve (the green SAXS curve in panel E). Chi-squared value for the data fit was 4.87. The data fit in the Q-range between 0.16 and 0.22 Å−1 are shown in the inset.

