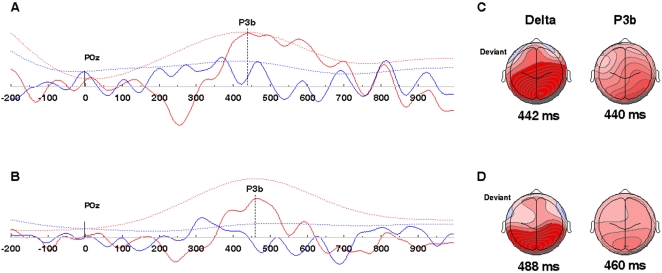
Figure 3. Grand averaged difference waveforms (deviant-standard) illustrating the MMN at electrode coordinate FCz.
(A) Depicts the MMN waveform component (left) and topographic distribution (right) from the control group. (B) Depicts the comparable waveform and topographic map from TD participants. A 1-way ANOVA indicated a significant main effect of group (F(1,16) = 5.46, p = .0328).

