
Figure 7. Change in nanoceria spectrum over time after addition of catalase.
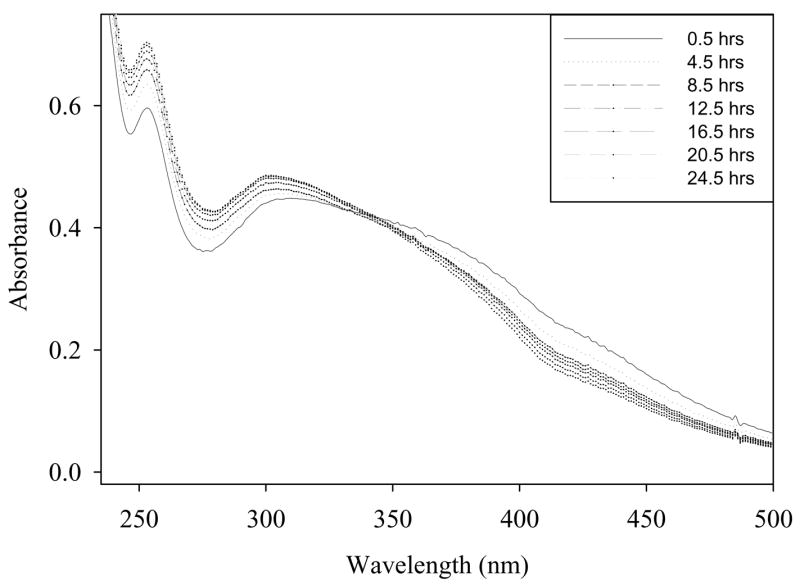
Spectrophotometric analysis of hydrogen peroxide treated nanoceria. Samples were treated with hydrogen peroxide for two days to insure oxidation of nanoceria then four units of catalase were added to remove excess peroxide. Note the peak at 252 nm corresponding to cerium (III) was previously obscured by excess hydrogen peroxide.