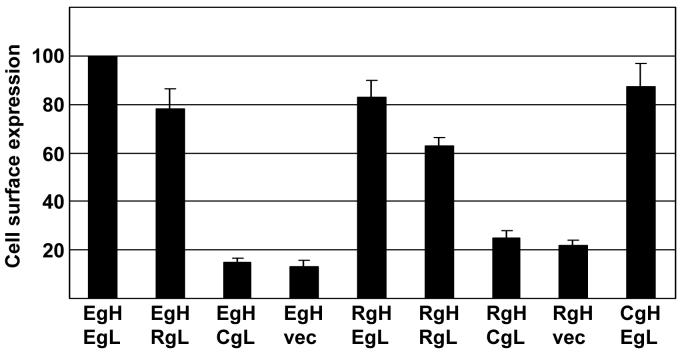
Figure 1.
Surface expression of virus proteins measured by flow cytometry of CHO-K1 cells transfected with plasmids expressing the indicated combinations of EBV gH (EgH), EBV gL (EgL), Rh-LCV gH (RgH) and Rh-LCV gL (RgL), CalHV3 gH (CgH), CalHV3 gL (CgL) and empty vector (vec) together with EBV gB. Combinations were stained with Mab E1D1 (combinations that included EBV gL or RH-LCV gL ) or CL40 (combinations without EBV or Rh-LCV gL) and fluorescein-conjugated sheep anti-mouse antibody. Values are the mean level of fluorescence. Values for EBV gH and EBV gL, stained with Mab E1D1 or CL40 as appropriate, were set at 100 and values for each other combination are expressed as a percent of this. Vertical lines indicate the standard deviation of three experiments for each antibody.

