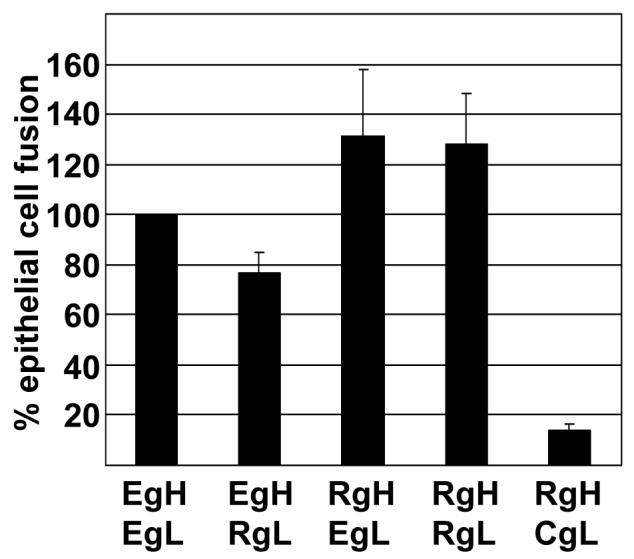
Figure 2.

Comparison of fusion of AGS cells supported by EBV and Rh-LCV gH. Cells were transfected with the indicated combinations of plasmids expressing EBV gH (EgH), EBV gL (EgL), Rh-LCV gH (RgH), Rh-LCV gL (RgL) and CalHV3 gL (CgL) together with EBV gB. Cells were stained with Mab CL55 to gB and fusion events were counted by fluorescence microscopy. Numbers of cells containing four or more nuclei were considered as having undergone fusion and the percent of cells that had undergone fusion with each combination of proteins is expressed as a percentage of those that had undergone fusion with EBV gH and EBV gL. Vertical lines indicate the standard deviation of five experiments.
