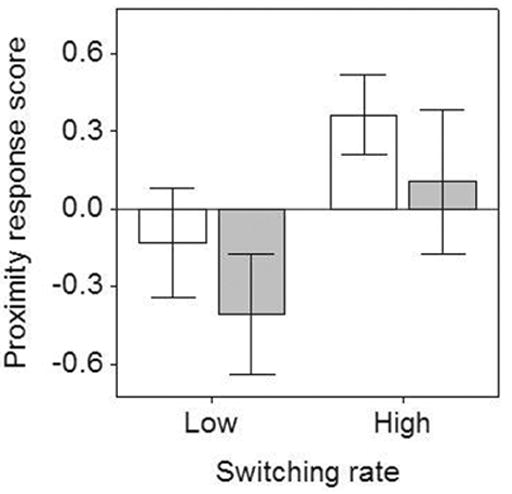
Fig. 3.

Mean proximity response scores during playback trials with low (white bars) and high (gray bars) within-song versatility at low and high between-song switching rates. Error bars reflect one SE. Higher score values correspond to closer approach.
