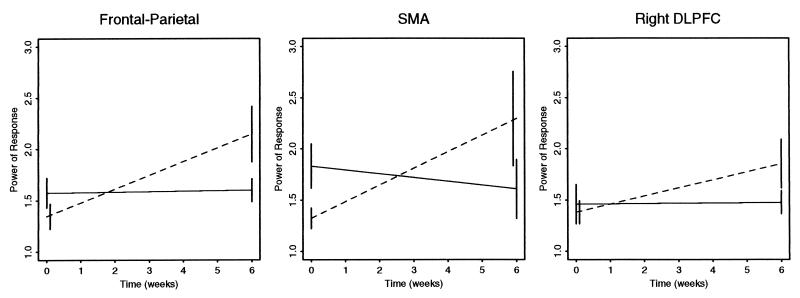
Figure 2.
Interaction plots. The mean regional power of response in supplementary motor area (SMA; Middle) and right dorsolateral prefrontal cortex (DLPFC; Right) is shown for each patient cohort at each assessment: solid lines represent typically treated cohort; broken lines represent risperidone-treated cohort; error bars denote ± standard error of the mean. Also shown is mean power of response averaged over these two regions and bilateral areas of precuneus (the frontoparietal supraregional measure shown in Left).

