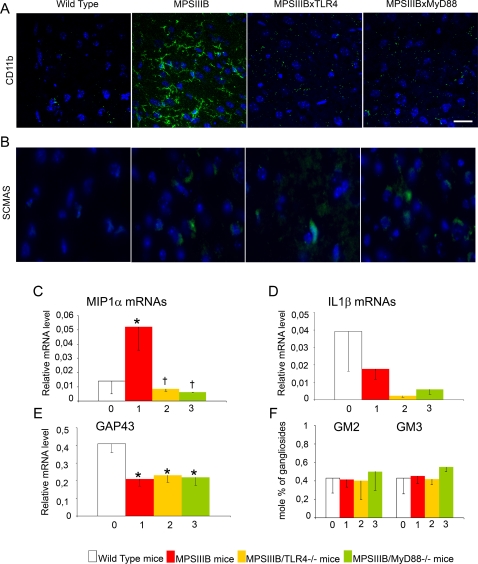
Figure 3. Microglial cell activation and pathology markers in the brain at 10 days.
Wild type mice (0, white bars), MPSIIIB mice (1, red bars), MPSIIIB×TLR4−/− mice (2, yellow bars), MPSIIIB×MyD88−/− mice (3, green bars) were analyzed at the age of 10 days. Inflammation markers were studied in cortical samples stained with anti-CD11b antibody (green in A) and by measuring the relative amounts of MIP1α (C) and IL1ß (D) mRNAs by quantitative RT-PCR. Disease markers were studied in cortical samples stained with the anti-ScMAS antibody (green in B), and by measuring the relative amounts of GAP43 mRNAs (E) and the accumulation of GM2/GM3 gangliosides (F). Immunofluorescence (A and B): nuclei are stained in blue with Hoescht, scale bars: 20 µm for CD11b, 50 µm for ScMAS. Representative pictures from 3 MPSIIIB, 3 MPSIIIB×TLR4−/− and 3 MPSIIIB×MyD88−/− examined mice. RT-Q-PCR (C, D, E): mRNA amounts are expressed relative to the reference ARPO mRNA [53]. Asterisks indicate significant difference with wild type mice and crosses indicate significant differences with untreated MPSIIIB mice (p<0.05, Mann and Whitney non-parametric test). Number of mice used for GAG, gangliosides and mRNA analyses: wild type mice, n = 6; MPSIIIB mice, n = 6; MPSIIIB×TLR4−/− mice, n = 5; MPSIIIB×MyD88−/− mice, n = 2.

