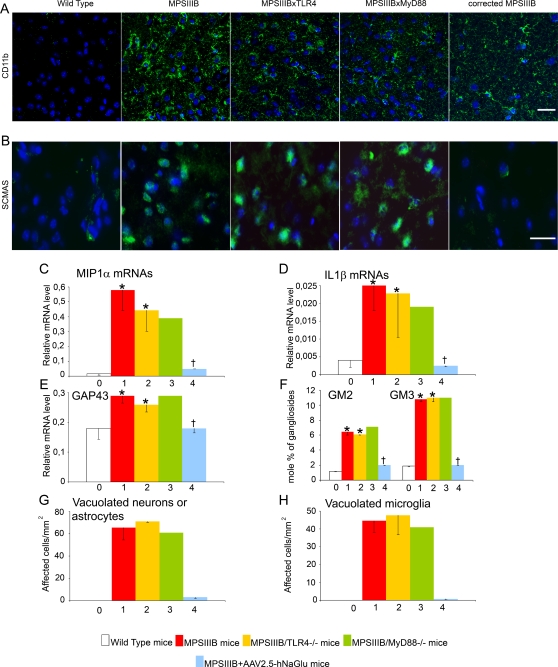
Figure 5. Microglial cell activation and pathology markers in the brain at 8 months.
Wild type mice (0, white bars), MPSIIIB mice (1, red bars), MPSIIIB×TLR4−/− mice (2, yellow bars), MPSIIIB×MyD88−/− mice (3, green bars), or MPSIIIB mice in which the genetic defect was corrected in the brain by a single intracerebral injection of AAV2.5-hNaGlu vector (4, blue bars) were analyzed at the age of 8 months. Inflammation markers were studied in cortical samples stained with anti-CD11b antibody (green in A) and by measuring the relative amounts of MIP1α (C) and IL1ß (D) mRNAs by quantitative RT-PCR. Disease markers were studied in cortical samples stained with the anti-ScMAS antibody (green in B), and by measuring the relative amounts of GAP43 mRNAs (E), the accumulation of GM2/GM3 gangliosides (F), and the frequencies of vacuolated neurons or astrocytes (G) and vacuolated microglia (H). Immunofluorescence (A and B): nuclei are stained in blue with Hoescht, scale bars: 20 µm for CD11b, 50 µm for ScMAS. Representative pictures from 3 MPSIIIB, 3 MPSIIIB×TLR4−/− and 3 MPSIIIB×MyD88−/− mice. RT-Q-PCR (C, D, E): mRNA amounts are expressed relative to the reference ARPO mRNA [53]. Pathology (G and H): semi-thin sections (1 µm) were stained with toluidin blue. At least 90 neurons/astrocytes were scored per mm2 section surface. Values are from 3 MPSIIIB, 3 MPSIIIB×TLR4−/− and 3 MPSIIIB×MyD88−/− examined mice. Examples of the morphology of cells that were scored as normal neurons or astrocytes, or vacuolated neurons or astrocytes are illustrated in figure S4. Asterisks indicate significant difference with wild type mice and crosses indicate significant differences with untreated MPSIIIB mice (p<0.05, Mann and Whitney non-parametric test). Number of mice used for GAG, gangliosides and mRNA analyses: wild type mice, n = 5; MPSIIIB mice, n = 10; MPSIIIB×TLR4−/− mice, n = 4; MPSIIIB×MyD88−/− mice, n = 1; MPSIIIB+AAV2.5-hNaGlu mice, n = 3.

