
Figure 2.
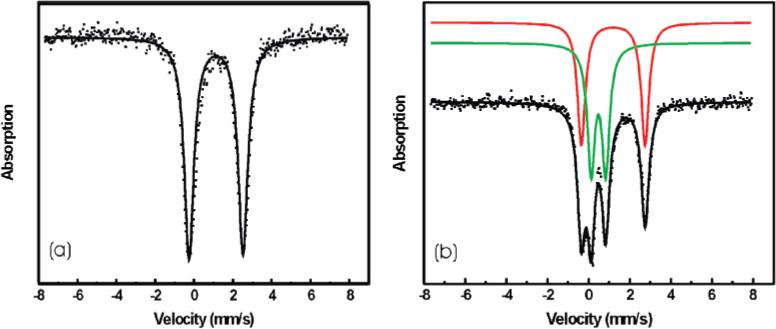
Mössbauer spectra of (a) 9-P and (b) oxygenated intermediate 10. The experimental data are displayed as dots, and the fits are displayed as solid lines.
Official websites use .gov
A
.gov website belongs to an official
government organization in the United States.
Secure .gov websites use HTTPS
A lock (
) or https:// means you've safely
connected to the .gov website. Share sensitive
information only on official, secure websites.
Mössbauer spectra of (a) 9-P and (b) oxygenated intermediate 10. The experimental data are displayed as dots, and the fits are displayed as solid lines.