
Fig. 11.
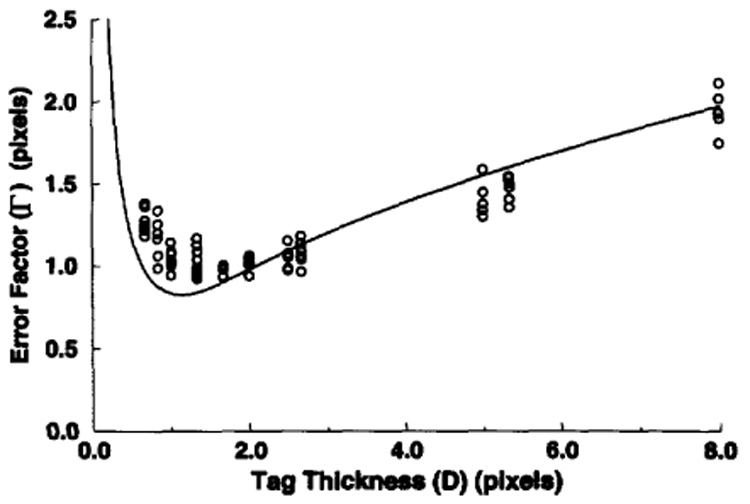
Experimental measurement results of the error factor (Γ) for different tag thicknesses. Each circular symbol corresponds to an estimate of the error factor from 128 profiles on a single tag line. The calculations are carried out for 13 images with six tag lines on each. The lower bound for the error factor is shown as a solid line.