
Fig. 6.
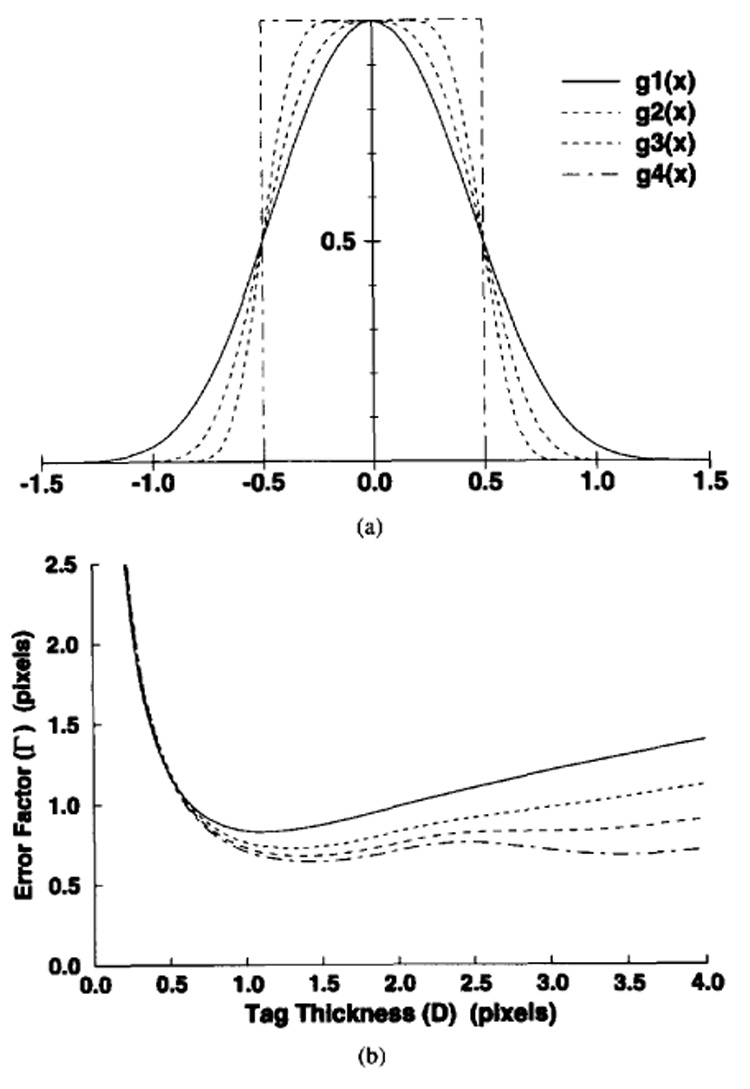
Sample normalized tag profiles, g(x) and error factor, Γ, curves. For these sample plots, the line spread function is assumed to be sinc as in (3). The tag profiles are given in (a), corresponding error factors curves are given in (b)‥ g1(x) and g4(x) are the Gaussian and rectangular tag profiles, respectively.