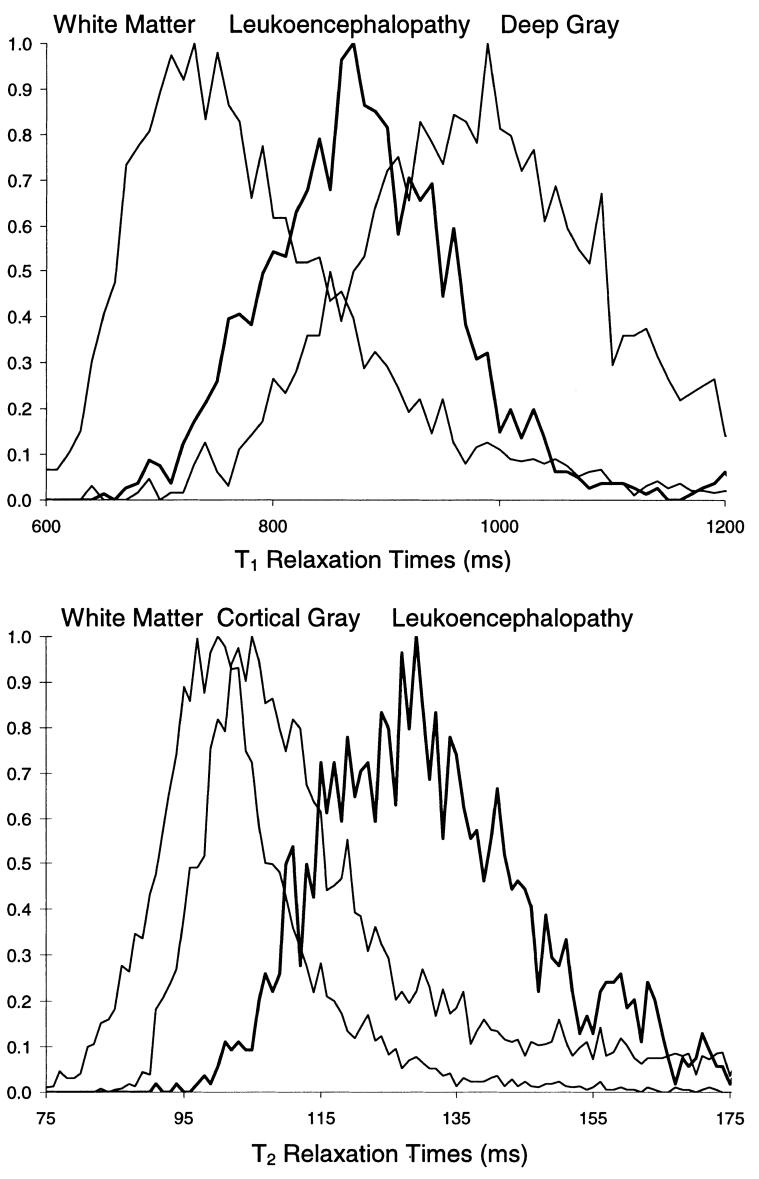
FIG. 2.
Normalized histograms of T1 (top) and T2 (bottom) relaxation rates demonstrate the overlap of the MR characteristics of leukoencephalopathy and those of normal tissues in an image from a single patient. In general, both relaxation rates are lower for white matter than for gray matter; the relaxation rate of deep gray structures (i.e., putamen, caudate, and thalamus) is lower than that of cortical gray matter but higher than those of white matter. The T1 relaxation rates of leukoencephalopathic tissue (bold line) lies directly between and completely overlaps those of white matter and deep gray matter. As would be expected, the T2 relaxation rate of leukoencephalopathic tissue is, on average, higher than those of cortical gray matter and white matter.

