
Figure 3.
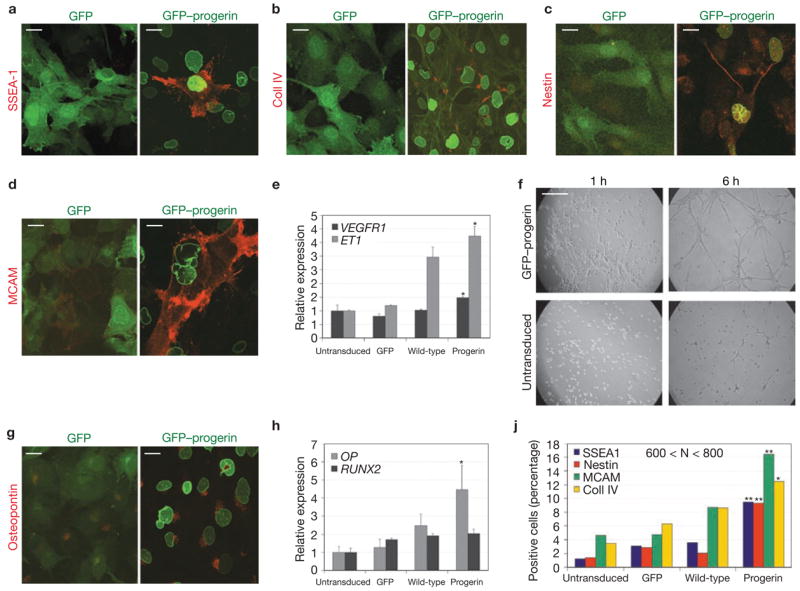
Progerin alters the molecular and cellular identity of hMSCs. (a–d, g) Immunofluorescence microscopy of undifferentiated hMSCs expressing GFP or GFP–progerin using the indicated antibodies. Merge between the GFP signal (green) and the antibody signal (red) is shown. FITC–phalloidin was used together with anti-collagen IV to show the cellular edge. Scale bar: 20 μm. (e, h) Quantitative RT-PCR analysis of expression levels of endothelial (e) and osteogenic (h) markers in untransduced hMSCs and cells expressing GFP, GFP–progerin, or GFP–wt-lamin A. Statistical significance of the differences between progerin-expressing and untransduced cells is indicated by one asterisk (P < 0.05). Values represent mean ± s. d from two experiments. (f) Angiogenic assay. Undifferentiated hMSCs expressing GFP–progerin or untransduced were plated onto basement membrane extract in the presence of 10 ng ml−1 h VEGF. Pictures were taken at the indicated times after plating. Scale bar: 1 mm. (j). Quantification of differentiation markers in undifferentiated hMSCs expressing GFP, GFP–progerin or GFP–wt-lamin A, or untransduced. Statistical significance of the differences between progerin- and wild-type lamin A-expressing cells is indicated by one (P < 0.05) or two (P < 0.0005) asterisks. 600 < N < 800 cells.