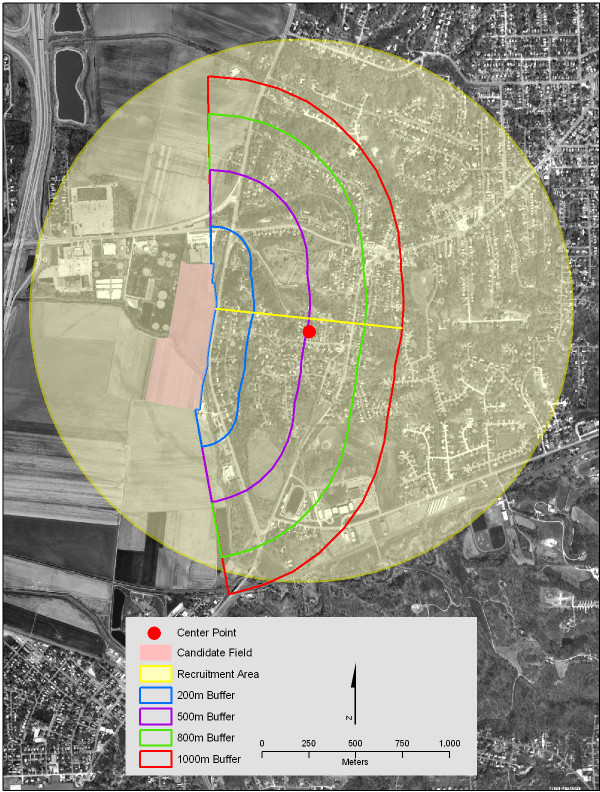
Figure 3.
Center point of study area and resulting recruitment boundary. Using GIS functions, a straight line was drawn from the center of the field boundary arc closest to the residential area past the centroid of the 1000-meter buffer, to the edge of the 1000-meter buffer. The center point of this line was designated as the recruitment area centroid. The yellow line was created by buffering the address closest to the recruitment area centroid at a distance that included all homes in the recruitment area.

