Figure 1.
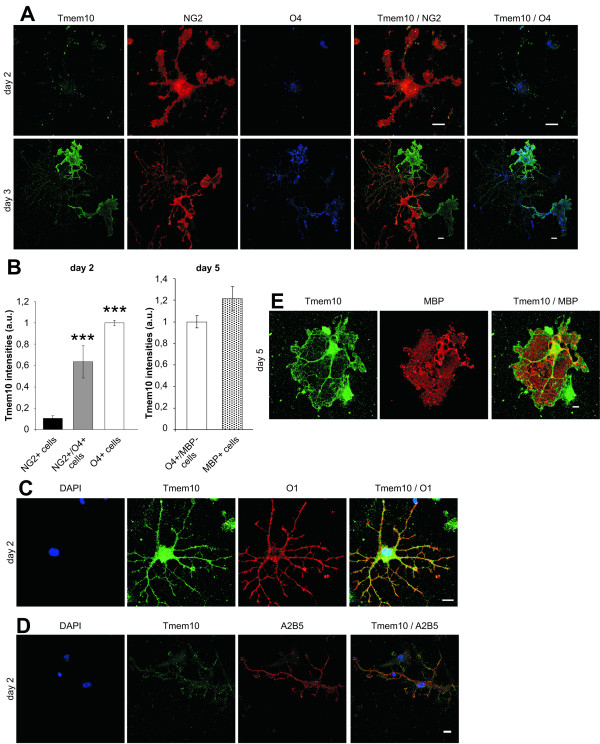
Tmem10 is expressed during oligodendrocyte differentiation. (A) Primary oligodendrocytes were cultured for 2–3 days and levels of Tmem10 (green) expression were determined by immunofluorescence. The developmental stage of the cells was determined by costaining for NG2 (red) or O4 (blue). (B) Quantitative analysis of the Tmem10 immunofluorescence intensities. Values represent the mean ± SEM (n > 20 cells, ***p < 0,001). (C) Tmem10 (green) is expressed in O1 (red) positive oligodendrocytes (day 2) and (D) Tmem10 (green) is weakly expressed in A2B5 (red) positive cells (day 2). (E) Tmem10 (green) localizes to processes and rims of mature oligodendrocytes, expressing MBP (red) (day 5). Scale bars, 10 μm.

