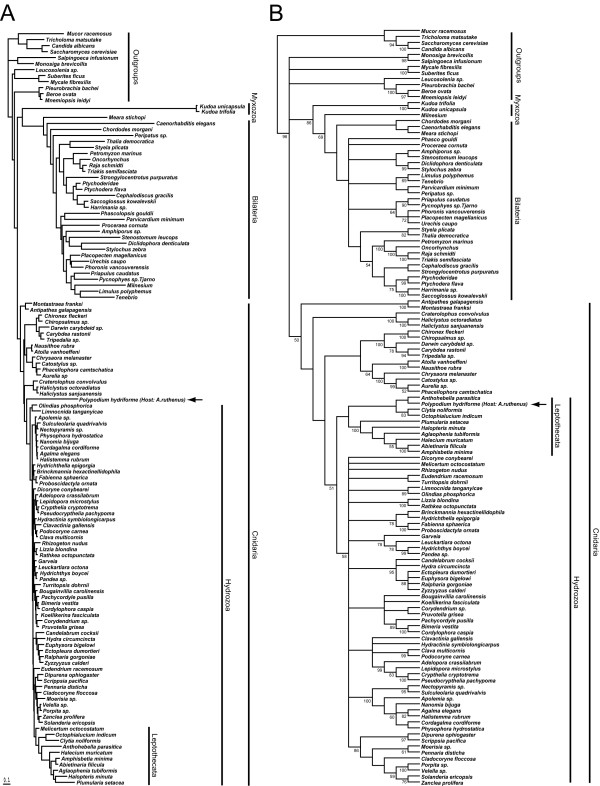
Figure 2.
Phylogenetic hypotheses of relationships among 126 metazoan taxa, based on a combined analysis of nearly complete 18S and partial 28S rDNA sequences. Arrow indicates Polypodium taxa. A) Maximum likelihood topology. The assumed model (GTR+I + G) has six substitutions rates estimated from the data (A-C, 1.1786; A-G, 3.3654; A-T, 1.7283; C-G, 0.7403; C-T, 4.7803; G-T, 1.0000), an assumed proportion of invariant sites (0.1692) and a gamma shaped parameter or (0.5584). The length of the bar indicates 0.1 substitutions per site. Bootstrap values for this topology are indicated on the cladogram in Additional file 1. B) Strict consensus of 32 trees of length 25141 from a parsimony analyses. Bootstrap values of 50 or greater are indicated.

