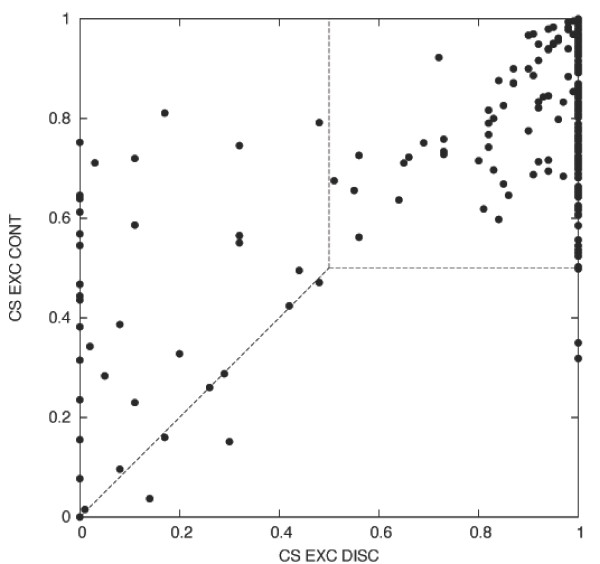
Figure 5.
Comparison of the EXC DIS and EXC CONT conservation scores for the known positive instances. Each dot represents a known positive instance and its corresponding EXC DISC and EXC CONT conservation scores. Dots in the upper right square correspond to well conserved instances that score highly with both models. Dots on the left half and above the diagonal, indicate poorly conserved instances that are scored higher by the EXC CONT model.

