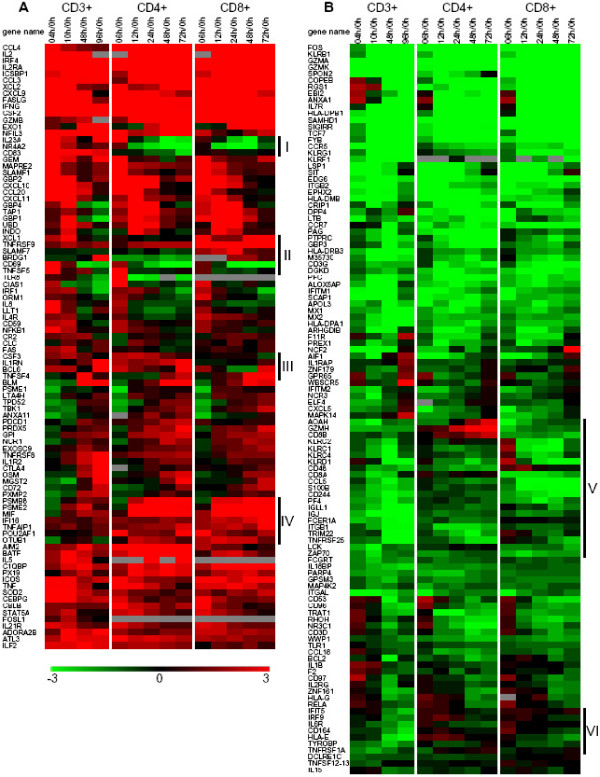
Figure 3.
Expression profiles of genes associated with the Gene Ontology term 'immune response'. Genes that were differentially expressed temporally in T-cell activation of the three (CD3+, CD4+ and CD8+) populations were divided into two groups (A with mostly upregulated genes and B with mostly downregulated genes) according to their distinct expression patterns based on hierarchical clustering using the Euclidian distance metric. Color denotes degree of differential expression compared to 0 hour (saturated red = 3-fold up-regulation, saturated green = 3-fold down-regulation, black = unchanged, gray = no data available). Clusters (I-VI) of genes with different expression patterns among the three populations were noted on the side. Expression data shown are averages from three independent biological experiments for each T-cell population.

