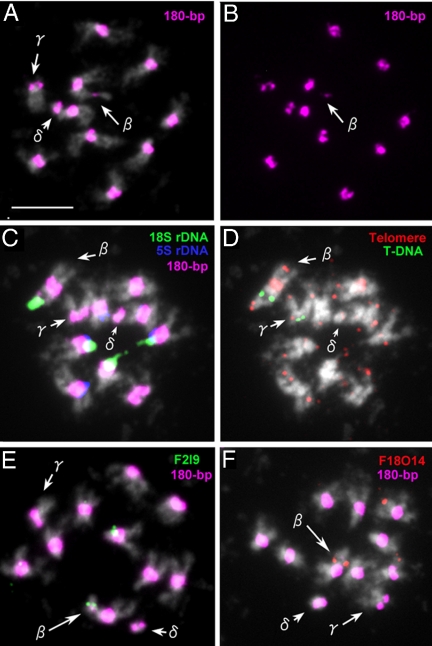
Fig. 3.
Cytological analysis of a G40 offspring containing chromosomes β, γ, and mini δ. (A) A mitotic metaphase cell probed with 180-bp repeats (pink). (B) The same cell showing only 180-bp repeat signals (pink) to clearly visualize the weak signal on chromosome β. (C) A mitotic metaphase cell probed with 180-bp repeats (pink), 18S rDNA (green), and 5S rDNA (blue). (D) The same cell probed with telomeric DNA (red) and T-DNA (green). (Note: a weak telomere signal on mini δ is from an adjoining chromosome.) (E) A mitotic metaphase cell probed with 180-bp repeats (pink) and F2I9-BAC (green, AGI-map position of chromosome 2:173440–276564). (F) A mitotic metaphase cell probed with 180-bp repeats (pink) and F18O14-BAC (red, Altman-map of chromosome 1: 29205). (Scale bar: 2 μm.)

