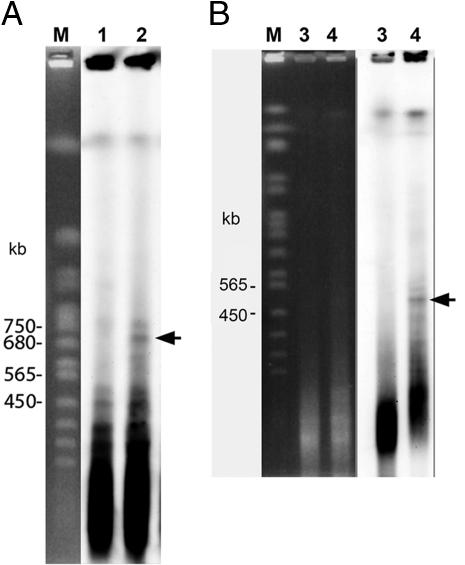
Fig. 5.
PFGE/Southern blot analysis for plants carrying mini α and mini δ for size determination of the 180-bp arrays. (A) PFGE pattern of plants without (lane 1) and with mini α (lane 2). (B) PFGE pattern of plants without (lane 3) and with mini δ (lane 4); M: DNA marker from Saccharomyces cerevisiae. Genomic DNA was digested with HpaII. The 180-bp repeat was used as a probe. Specific bands corresponding to ≈700 and 500 kb from plants containing mini α and mini δ, respectively, are marked with arrows.

