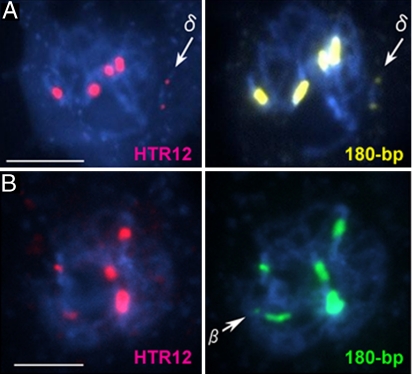
Fig. 6.
HTR12-immunostaining and FISH analysis. (A) A pachytene cell of a Tr δ plant carrying mini δ after fluorescent immunolabeling by using anti-HTR12 antibodies (pink) and FISH using 180-bp repeats (yellow). The arrows indicate mini δ. (B) A pachytene cell of a plant carrying chromosome β after fluorescent immunolabeling by using anti-HTR12 antibodies (pink) and FISH using 180-bp repeats (green) to the pachytene chromosomes. The arrow indicates the small 180-bp sites on chromosome β. (Scale bars: 5 μm.)

