Fig. 3.
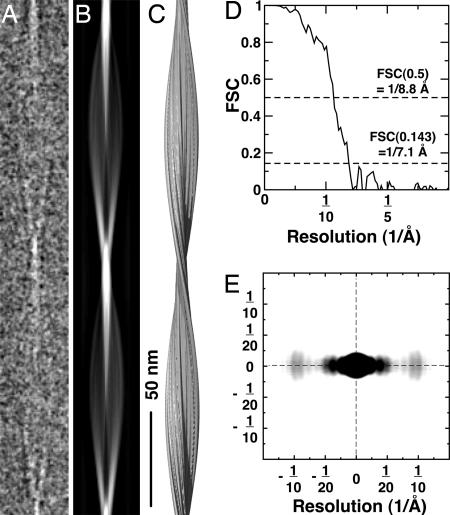
A 3D reconstruction of Aβ(1-40). (A) Ice-embedded Aβ(1-40) fibril cropped from a raw electron micrograph, displaying the distance of one helical pitch. (B) Projection of the 3D fibril reconstruction shown in the C. (C) Side-view surface rendering of the fibril reconstruction. The structure was prepared by using UCSF CHIMERA (35). (D) Fourier shell correlation curve of the reconstruction indicates a resolution of ≈8 Å. (E) Electron diffraction pattern calculated by using the fibril cryo-EM reconstruction. The equatorial reflections peak at ≈10 Å and show diffuse intensity between 8 and 12 Å, representing the β-sheet spacing. The intensity distribution at lower resolution reflects the protofilament thickness (≈20 Å nm). Possible structural disorder in the fibril and solvent effects were not included in the calculation of the pattern, leading to differences between the calculated and experimentally observed intensities.

